Our Commitment
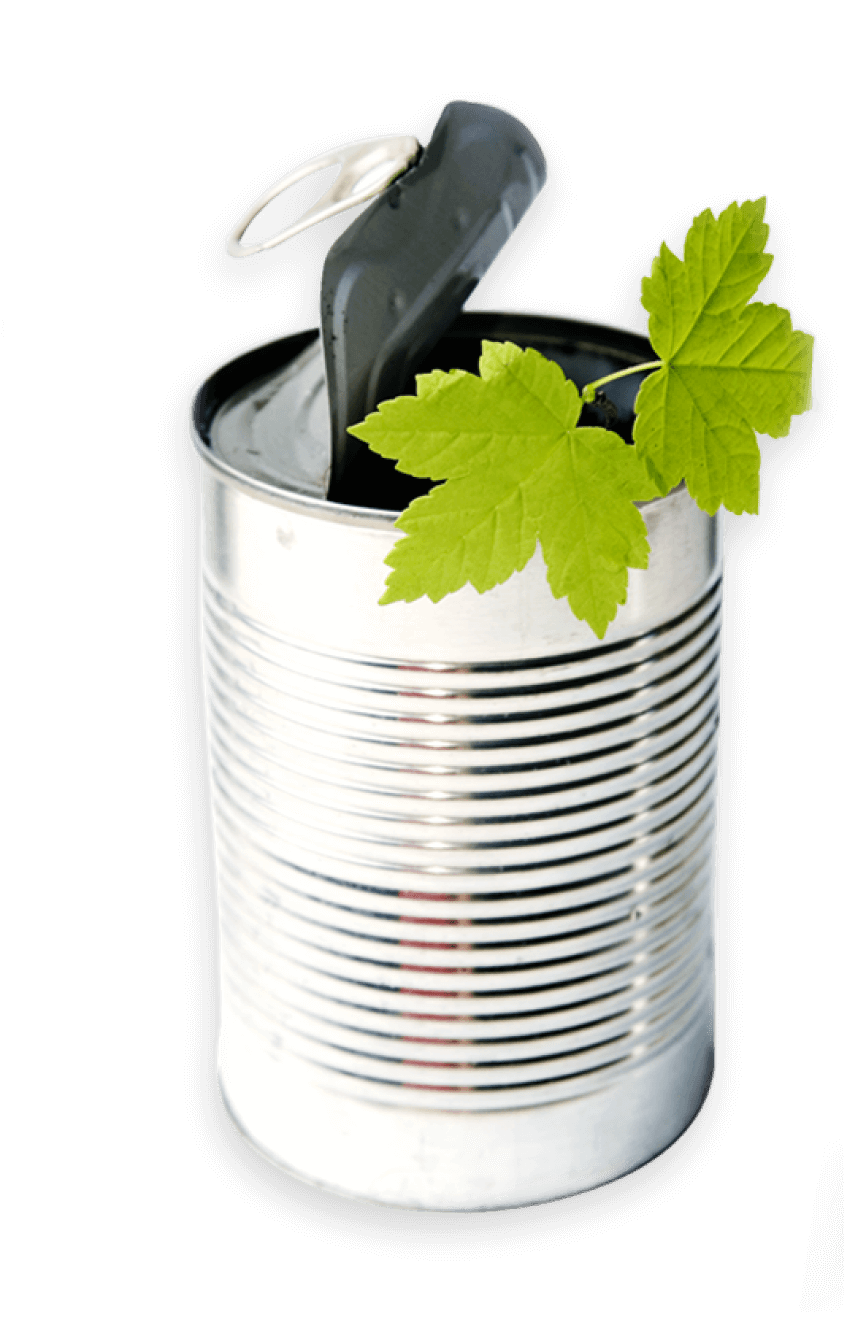
Sustainability Targets
Silgan Holdings set multiple sustainability targets in their 2023 sustainability update report. These include:
-
Reduce operational carbon footprint intensity by 50% by 2030 from 2017 baseline.
-
Source 50% of electricity from renewable sources by 2030.
-
Commitment to establishing and publishing:
- Commit to science based targets
- Waste targets
- Water stewardship plan
- Scope 3 GHG emissions
- Annual reporting to CDP
2023 Data Highlights
CONTAINERS DIVISION
GHG EMISSIONS (Tonne CO2e)
Silgan furthered our greenhouse gas (GHG) reduction in 2023 by reducing our Scope 1 and Scope 2 emissions by 36.2%. This was driven by three trends: improvements in our energy efficiency, matching our electricity consumption with renewable energy, and the ongoing decarbonization of the U.S. electricity grid.

(Swipe to view data)
Silgan began tracking our Scope 3 emissions in 2022 and is undertaking an exercise to calculate historical Scope 3 emissions back to our 2016 baseline. Over 95% of our 2023 emissions derived from Scope 3. Of these, our purchased goods and services comprised the majority of the contribution.

(Swipe to view data)
ENERGY (GJ)
Since 2016, we have reduced our total energy consumption by 8.1%. Energy efficiency improvements are driven by our continuous improvement philosophy. Additionally, we are a partner of the Department of Energy’s Better Plants Program and actively review project recommendations for implementation.

(Swipe to view data)
WASTE (tonne)
Silgan’s hazardous waste decreased 42.7% vs. 2020. Non-hazardous waste decreased by 12.6%. Silgan has implemented a recycling program to optimize waste disposal in our facilities. This program is part of our long-term strategy to implement circularity in our operations.

(Swipe to view data)
WATER WITHDRAWAL (m3)
Our water withdrawal was 547,433 cubic meters in 2023–a 7.5% decrease versus 2020. Water withdrawal in high water stress areas decreased by 43.8% over the same period. Silgan is developing a water stewardship program to optimize our water withdrawal and consumption.

(Swipe to view data)
Note: we have removed water data for three of our facilities. Concern over data integrity has led Silgan to reexamine their data sources. Data for these facilities will be added back in future reporting once we confirm their accuracy.
Strategic Oversight
Sustainability is not just important to us, it is critical for our food manufacturing customers and end consumers. That is why sustainability is one of our five core imperatives across the entire organization.
To ensure we are working on the right projects and objectives, we employ both a top-down and bottom-up approach to ensure the initiatives we undertake have our full commitment and are resourced to achieve their highest potential.
From executive leadership down to each individual location, the entire Silgan Containers community is committed to delivering on our sustainability targets and goals.
Steering Committee
The Steering Committee is responsible for overseeing and executing our program. It reviews data reporting, programs and initiatives, and overall strategy.
Sustainability Team
The Sustainability Team manages the day-to-day operations of the program: data collection, program implementation, customer reports, stakeholder engagement, etc.
Supporting Departments
Several departments support the Sustainability Team and Steering Committee on our sustainability program. These include:
- Engineering – Project management related to energy and resource consumption
- Human Resources – Employee engagement and wellness
- Marketing – Stakeholder communications
- Operations – Production and facility management
- Regulatory – Compliance with regulations and voluntary codes
- Safety – Safety risk identification and mitigation
- Sales – Customer requests and expectations
Sustainability Programs

- Voluntary partnership with DOE on energy efficient facilities
- Approx. 75% of facilities audited and over 40 recommendations implemented.

- Financed wind energy farm in Ford County, IL.
- Approx. 135k MWh energy generated annually.
- Investigating Phase 2 VPPA & on-site renewable energy.
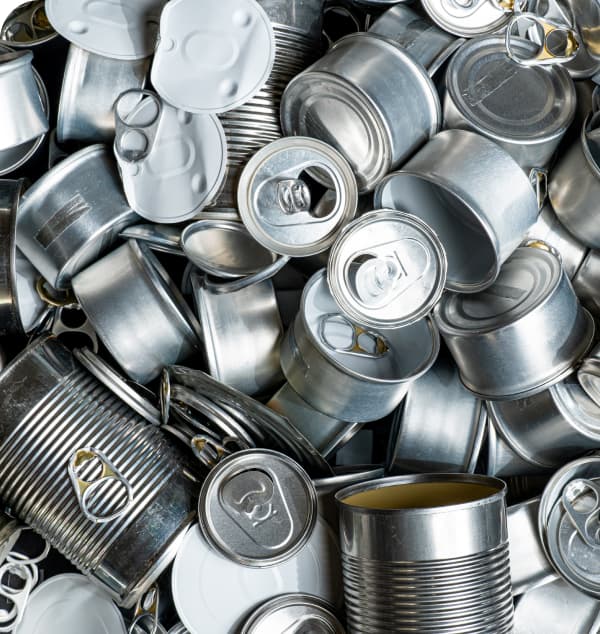
- Partnership with waste disposal provider to maximize recycling in all facilities.
- Part of longer-term push to achieve zero waste to landfill and circularity in operations.
- Launched recycling signage to standardize recycling communication companywide.

- Partnership with waste disposal provider to maximize recycling in all facilities.
- Part of longer-term push to achieve zero waste to landfill and circularity in operations.
- Launched recycling signage to standardize recycling communication companywide.
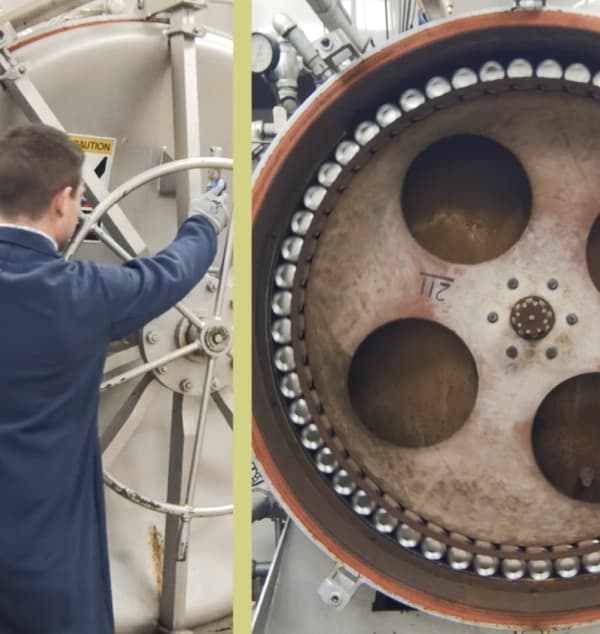
- Top priority in our operations remains the safety of our employees.
- Industry-leading OSHA recordable incident rate of 1.26 (incidents/100 employees).
- Approx. 50% or our facilities reported zero recordable work-related incidents in 2023.
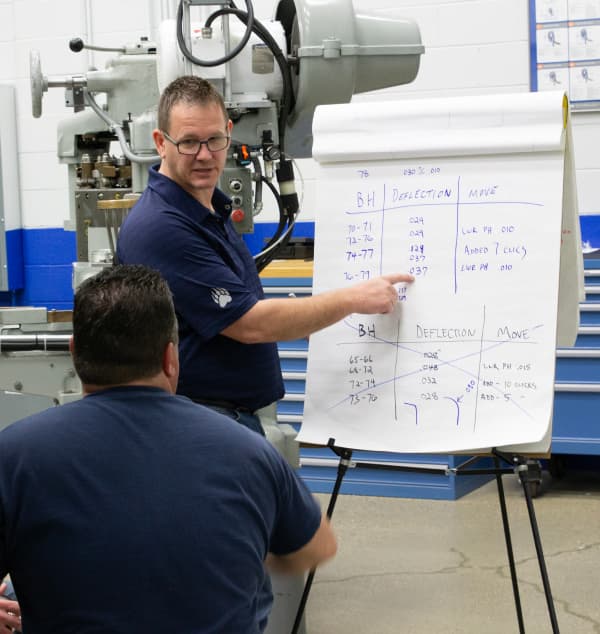
- Engineering and Sales teams, plant personnel training on sustainability at Silgan.
- Shared meals and employee gatherings to celebrate retirements, safety performances, etc.

- Participation in community events (fundraising, career fairs, etc.).
- Educating consumers on the sustainability benefits of metal food cans.
- Companywide National Canned Food Month drive donated over 70,000 lb. of canned food to local food pantries.
The Benefits of Aluminum and Steel
Aluminum and steel are two of the most sustainable materials in the world, valued for their durability (unique strength characteristics), shelf stability for food products (nutrition preservation without refrigeration energy requirement), and 100% and infinite recyclability (ideal for circularity). Each substrate offers advantages and opportunities depending on the product fill and market.
Food Waste
Metal food packaging is recognized for its shelf stability
- Long-term preservation reduces food waste
- Food waste is a top contributor to global GHG emissions 1
Energy Savings
Metal food packaging does not require energy-intensive preservation methods
- No refrigeration or freezing means less GHG emissions
Recyclability
Aluminum and steel are two of the most recycled materials in the US and globally 2 3 4
- US food cans – Steel: 58% 5 | Aluminum: 45.2% 6
- High value product in recycling stream
- Drives down carbon intensity
Recycled
Content
Aluminum production can consume recycled aluminum
- Different alloys tolerate different recycled content amounts
- Post-industrial and post-consumer both acceptable
Steel production can consume recycled steel
- Metal chemistry and quality requirements for food packaging currently dictate recycled content
- Post-industrial and post-consumer both acceptable
Carbon
Intensity
Aluminum production is carbon intensive due to current technologies
- Reduction of alumina with carbon anodes to extract oxygen
- High recycled content mitigates GHG concerns
Steel production is carbon intensive due to current technologies
- Reduction of pig iron with oxygen to extract carbon
- Steel suppliers are investing in less carbon–intensive technologies
Circularity
Aluminum and steel can be recycled infinitely, positioning them as crucial materials in the circular economy
- Most aluminum and steel ever produced is still in use today 7 8
Bottom Line
Aluminum and steel substrates have a distinct sustainability advantage due to their unique chemical properties, longevity in the market, and inherent circularity. Technology and process improvements over the next few decades by aluminum and steel mills will address the substrates’ carbon intensities, positioning them as two pivotal materials in the future circular economy.
- Zhu, Jingya, et al. Cradle-to-grave emissions from food loss and waste represent half of total greenhouse gas emissions from food systems. Nature Food, 2023.
- USEPA, Facts and Figures about Materials, Waste, and Recycling.
- International Aluminum, Aluminum Recycling Factsheet.
- Bureau of International Recycling, World Steel Recycling in Figures, 2017-2021.
- The Aluminum Association, The Aluminum Can Advantage.
- American Iron and Steel Institute et al., Determination of Steel Container Recycling Rates in the United States.
- The Aluminum Association, Recycling
- SUSTAIN Steel, Scrap: Our Greatest Resources?
Committed to Efficiencies Through the Supply Chain
Easy handling, fast filling with low spoilage makes cans a natural choice for streamlined, cost-efficient production and reliable distribution.
less energy
Food cans require up to 70% less energy throughout the supply chain compared to refrigerated and frozen foods. (Metal Packaging Europe)
Less secondary packaging
Cans require significantly less secondary packaging than alternative packages because of their inherent strength. (Metal Packaging Europe)
Stock up
Canned foods’ long shelf-life and preserved taste let consumers stock up and stay supplied. (CannedGood.org)
Storage benefits
In the retail environment, steel packaging can be easily stored, handled and stacked. It is virtually impossible to spill or break. (APEAL, Steel for Packaging Naturally)
Reduced emissions
New steel produced with recycled cans reduces greenhouse gas emissions by 75%. (Can Central)
Lower transportation costs
Silgan has over two dozen manufacturing facilities throughout the United States, which allows for significant savings in transportation costs. (Contact Silgan)
Recyclability
Steel & Aluminum: Infinitely Recyclable
While our packages protect and preserve our customers’ products, thanks to their 100% recyclability they are also helping to minimize our impact on the environment.
80-90%
of all steel ever produced is still in use today (Arcelor Mittal, 2024).
Steel cans have a
58%
recycling rate, the highest of any food
package (Canned Good, 2024).
Nearly
75%
of all aluminum ever produced is still in use today (The Aluminum Association, 2024).
How Recycling
Steel Saves Resources
Saves natural resources
Every ton of recycled steel saves 3,600 pounds of CO2, 2,500 pounds of iron ore, 1, 400 pounds of coal and 120 pounds of limestone (Can Manufacturers Institute).
Saves energy
Recycled aluminum requires 95% less energy than producing new aluminum and generates only 5% of the greenhouse gas emissions. 75% of all aluminum produced in history is still in use (The World Counts).
Reduces waste
Making new steel products from recycled steel reduces water use by 40%, water pollution by 76%, air pollution by 86% and mining waste by 97% (EURIC AISBL).
Educational Resources
Silgan is dedicated to raising awareness of recycling and sustainability within the industry. We connect people to educational, environmental and recycling resources, showing them how they can join us in the fight to spread environmental awareness and help save our planet.
